

%20(1).webp)
The finance world is quickly entering the mainstream —
Every month a notable company goes public. Every week a hot startup raises millions of dollars. And every day moms, pops, and teens check on their stocks.
Whether a company builds rocket engines or mobile apps, they tell their story using the same language — financial statements. Here's how they work.
Let's say you run a subscription t-shirt business.
It's going well — you have happy customers and healthy profit. You're thinking of buying your own factory to make more t-shirts, more quickly, and more cheaply.
There's just one problem — you can't afford a factory.
So, you ask the bank for a loan. Your company is profitable and the factory will pay for itself in 3 years, so you know you'll be able to pay it back. But while you know this, the bank doesn't — you'll need to convince them. The bank, however, doesn't know anything about the subscription clothing business.
To get on the same page, you need a shared language for talking about your business.
The Balance Sheet
Double-entry bookkeeping was the first formalism in finance. The Middle East had it in the first century AD, Korea independently got it in the 11th century, and by the 1500s, it had been well-documented across Europe.
It's a simple concept designed to reduce errors when documenting transactions: every entry to an "account" requires an equal and opposite entry to another "account".
If you bought some cotton to turn into t-shirts, you might record the transaction like this:
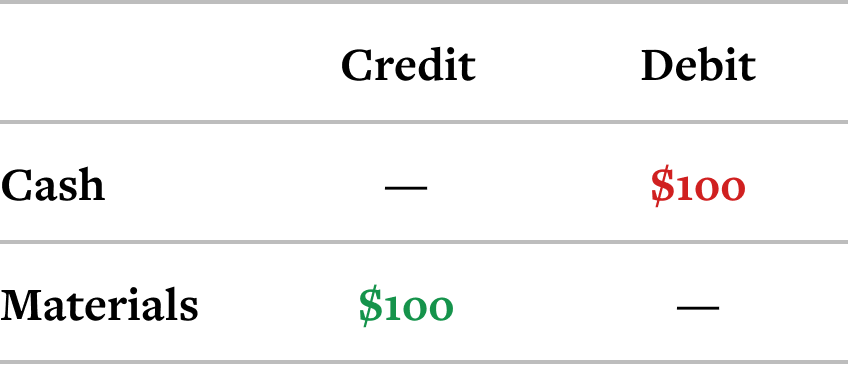
When you spend $100 on cotton, your "Cash" account gets debited (loses) $100, and your "Materials" account gets credited (gains) $100. The underlying principle is that you can't create something out of nothing.
This might seem contrived, but with more and more transactions, it can help you spot errors. Since every entry has an equal and opposite entry, the sum of all the debits should always equal the sum of all the credits. If not, you know you made a mistake, and you can look back through your transactions to find it.
A list of transactions is pretty interesting — it tells a very detailed story about what your company's been up to. Certainly enough to answer the bank's questions when you ask for loan.
But just as the doesn't have time to learn about subscription t-shirts businesses, they don't have time to go through thousands of transactions. To understand what's going on, they need a shorter summary.
If you went through all your transactions and worked out the net value of each account, you'd be able to see things like
- How much cash you have in the bank
- The total value of the cotton in your inventory
- How much money you owe to your cotton suppliers
This will give you a snapshot of the current state of your company, split up into "everything you own" (Assets) and "everything you owe" (Liabilities) — a Balance Sheet. These generally won't be equal — ideally your assets will be worth more than your liabilities.
The difference between the assets and the liabilities is what you, the owner of the company, can rightfully stake a claim to. Crudely, if you sold all your assets today and used that money to pay off all your debts, you'd be left with a pile of cash all to yourself.
This idea is usually expressed by the "accounting equation":
Assets - Liabilities = Shareholders Equity
This is where the "balance" comes in: both sides of the equation are equal. Note that this equation is actually a definition — it asserts that the value of the Shareholders Equity is the difference between Assets and Liabilities. This is the same equation that underpins double-entry bookkeeping.
Here's what your balance sheet might look like:

The bank will be interested in seeing this before giving you a loan. It's a quick 'n' dirty way for them to understand the big picture:
- The orders of magnitude involved — does this company operate in the thousands, millions, or billions?
- An estimate for how much the company is "worth", based on the shareholders equity
- An indication of company health — is the company drowning in debt?
Financiers often calculate metrics based on the balance sheet, to further summarise the information and to compare numbers across companies.
The Debt/Equity Ratio is a big one, telling you how much a company relies on borrowing money. If it's too high then the company might be too dependent on loans, but if it's too low, this might indicate an inefficiency, since borrowing money to spend on growth can be quicker than earning it the hard way.
So — the balance sheet summarises a lot about your company, in a way that the bank can understand.
Unfortunately, it doesn't answer a crucial question — "Do you make money?"
The Profit-and-Loss (P&L) Statement
The balance sheet is a snapshot of a single point in time. To understand whether a company makes money, you need see how things change over a period of time (e.g. every month).
The first thing you need to know is how much money you receive — your Revenue. You don't keep all of it — there are costs and expenses along the way — so you need to subtract these. The final number you end up with is your Profit — the money you've made at the end of the day.
Here's how you might do the calculation:

You start at Revenue (the top line), subtract your costs, and end up at Profit (the "bottom line" — get it?). This is a simple Profit & Loss (P&L), or Income Statement. Most companies make one every month, to keep an eye on things.

With a P&L, you and the bank can understand what's going in and out of your business. If your P&L consistently shows a profit, then the bank will be happy, and so will you.
In theory, this is very simple. But in practice, each P&L item has hidden nuances to address.
Let's take just the top line — what does Revenue actually mean?
What is 'revenue'?
When you started selling shirts, it was a simpler time — you bought them in bulk from China and sold them at the local market.
Revenue, too, was simple — it was the cold hard cash in your hand.
But things changed. You started taking bulk orders from shops, who pay you 1 month after you deliver the shirts. And when you went online, your customers started paying you for 12 month subscriptions, all in one go.
It turns out that if you keep thinking of revenue as "cash in your hand", then things get a little weird —
- When you get a bulk order, your expenses shoot up. But since you don't get paid until next month, your profit goes way down this month.
- When someone buys a 12-month subscription, your revenue spikes up. But for the next 11 months you have to keep delivering on the order (non-zero cost) without further payments (zero revenue) — your bottom line takes a hit.
Bulk orders and upfront payments are great for your business, but if revenue means "cash in hand", then your P&L might tell the opposite story.
A better way to think about revenue is as "the value of products delivered or service provided".
In each month of a subscription, you do 1 month of work. So even with 12 months' payment upfront, you only recognise 1/12th of that payment as revenue each month. The remaining 11/12th becomes Deferred Revenue. This is actually a liability on your balance sheet — your customers have essentially given you a loan which you must pay back each month, in the form of t-shirts.
The same principle applies for bulk orders — you recognise the revenue when you deliver the product, not when you get paid.
This is called Accrual Accounting, and it more accurately answers the question "Do you make money?".
So — you've got a balance sheet, showing your current financial state, and you've got a P&L, showing how things change over time. The bank, however, remains unsatisfied.
Sadly, consistent profits, measured with accrual accounting, can still leave you penniless on payday.
The Cashflow Statement
In 1863, the Dowlais Iron Company had a dilemma.
On paper, things were great — they'd recovered from a downturn and were posting healthy profits. To smelt more iron, they set out to buy a new blast furnace. But despite their promising P&L, it turned out that they had no cash to buy it.
What gives?
Their problem was in spending cash too quickly — as soon as they got some, they'd use it on inventory (iron ore, etc). The profits were rolling in, but the cash wasn't sticking around.
The company needed a way to understand how cash was coming in and out — the cashflow. Their solution was the origin of the modern Cashflow Statement.
Like the P&L, the cashflow statement shows how things change over each month, but crucially, it only focuses on cash — how much you started with, what you spent it on, where you got more of it, and how much you ended up with. In short, the cashflow statement explains the difference between one balance sheet and the next.

---
The bank should now have enough information to decide whether to give you a loan:
- Balance Sheet — shows everything that you own, and everything that you owe
- P&L/Income Statement — shows how your business operates
- Cashflow Statement — shows how you spend and earn cash
These financial statements are a shared language, letting businesses communicate across industries and borders. They also "flatten" a business' evolving operations — new business models, delivery methods, and products — to give a coherent view of a company through time.
Investors use financials to judge performance, lenders use them to assess credit-worthiness, and governments use them to make sure that taxes are correctly paid.
But the whole system only works if every company follows the same rules when compiling their financials. These rules require years of study to fully understand (this is why accountants exist) and include:
- How to recognise revenue — accrual accounting
- How to "amortise" costs — spreading upfront expenses over time
- How to "capitalise" costs — turning big purchases into assets on the balance sheet
Who made these rules?
Accounting standards
The Industrial Revolution (1760) was a major turning point for finance. Lots of companies were cropping up, and they were growing and transacting with each other in new and complex ways. It became increasingly important to have robust and accurate systems for keeping track of company accounts.
Professional accounting groups formed, and they made recommendations about best practices. But the 1929 stock market crash and Great Depression, caused partly by dodgy financial reporting, was the trigger that made accounting a matter of law.
The US government starting working with accounting groups to establish a set of rules for consistent and accurate financial reporting: generally accepted accounting principles, or GAAP. Separately, an international committee has been working on their own set of rules since the 1970s — the International Financial Reporting Standards, or IFRS — to get the whole world on the same page.
Today, 120 countries use IFRS, while the US uses GAAP.
If a company breaks their country's rules, it's called "accounting fraud", and someone might end up in jail. But both GAAP and IFRS leave a lot of room for subjectivity — on a spectrum from "squeaky clean" to "Enron circa 2001", most companies are somewhere in the middle.
Exploiting these grey areas is known as "earnings management" — producing optimistic numbers without explicitly breaking the rules. And everyone's doing it —
If you look at company earnings in aggregate, a surprising number of them seem to just about maintain the same performance from one year to the next. At best, this suggests that companies deliberately optimise for financial metrics, to look good to the public (see: Goodhart's Law). At worst, it suggests that they're "cooking the books" to avoid looking bad.
This chart shows the relative Earnings per Share of a group of companies from one year to the next. A positive number indicates a year-on-year improvement, and a negative number indicates a decline. There's a huge spike at 0, suggesting deliberate optimisation to maintain earnings, or "creative accounting".

It's really hard to make accounting standards airtight. Luckily, a group of people are trying to figure out why — accounting philosophers.
In his 2006 paper The FASB and Accounting for Economic Reality, Thomas Lee claims that the system's shaky philosophical foundations are the root cause of our problems. Namely, our current accounting standards implicitly assume that income and capital are an "intrinsic, brute reality of economic substance", when we should instead be thinking of them as "socially constructed abstract notions of economic reality". ¯\(ツ)/¯

The job of accounting standards is to ensure that financials are reported accurately. But it's worth remembering that financial statements are representations of reality, not reality itself. Companies have drastically changed over the past 50 years, but accounting standards haven't — the rulebook is out of date.
The "knowledge economy" has shifted the drivers of value creation away from the concrete — property, machinery, inventory — and towards the intangible — brand, intellectual property (e.g. patents), human resources (employees). But GAAP treats these intangibles as pure expenses — Google's biggest asset is probably their employees, but their balance sheet won't tell you this.
New business models are also poorly represented by GAAP metrics. Software-as-a-service (SaaS) makes up ~20% of the enterprise software market and is growing fast, but you won't find subscription metrics like MRR (monthly recurring revenue) and Churn on an income statement.
Looking forwards
These backwards-looking representations aren't terribly useful when thinking about the future. Financial statements now account for only 5% of the information that investors use to evaluate companies, and key accounting metrics, like Earnings and Assets, have stopped correlating with stock prices.
To fill these gaps, almost all companies report custom non-GAAP metrics in their financial reports, to paint a better picture of their business. WeWork famously defined a Community Adjusted EBITDA metric that ignored most of their costs to suggest that they were actually, sort of, profitable.
You can decide for yourself whether WeWork's metrics made sense. But that's precisely the problem — without consistent standards, "creative accounting" can cloud our judgment and our economy suffers.
For now, financial statements aren't going anywhere — if you participate in the economy, it's worth knowing your way around a balance sheet, P&L, and cashflow statement.
These statements, however, only tell you what happened in the past. To understand what might happen in the future, people generally build models that combine historical data with business assumptions in order to produce forecasts.
Causal is a great way to build these models :)

.svg)
.svg)